
Within the dynamic realm of Bitcoin investment, traders and investors are constantly in search of effective methodologies and tools to effectively capture the counterintuitive dynamics of the market. One such standout tool is the Funding Rate indicator, which offers valuable insights into Bitcoin’s market sentiment and potential price trends.
Funding Rate Chart:
Observing the Funding Rate chart, we notice a clear correlation between price peaks and exaggerated values in the Funding Rate, both for short and medium-term tops and bottoms.
Highly effective in predicting market bottoms
However, as Bitcoin is a scarce asset with growing demand, in the long run, it will always rise, and consequently, it is worth strongly emphasizing that the accuracy in indicating bottoms will always be better than indicating tops. Because the asset, in an uptrend, even reaching very high Funding Rate values, the price may correct very little and then rise again, renewing highs in price and even in the Funding Rate after these declines.
Analyzing the Funding Rate within Bitcoin's 4-year cycle
Given this pattern, we observe an efficient methodology for investing using the Funding Rate. The first step is to identify which moment of Bitcoin’s 4-year cycle one is in. These two main moments are called Bullrun and Bear Market. In the ‘Low-to-Low Comparison’ chart above, we can visualize these two phases well within the 4-year cycle.
Funding Rate Pattern in Bull Runs
During Bull Runs, the negative Funding Rate turns excellent buying opportunities, especially during strong declines, if they occur, where the FR becomes quite negative. This is more common to happen at the beginning of the Bull Run, shortly after the bottom has been marked.

During the strongest rallies, where the FR reaches absurd values like 0.05% to 0.15%, price corrections will make the funding rate drop to levels of 0.01%. Signaling buying opportunities if the rally continues. To determine if the rally will continue, it is important to use other indicators combined to identify the health of the market.
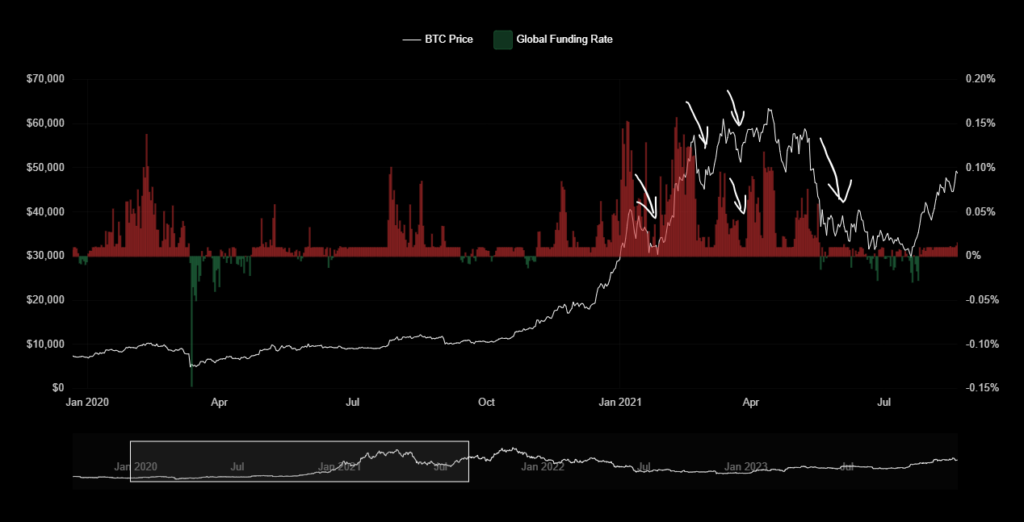
In the example shown in the image above, we have the 2021 bull run where the price was rising and the FR as well, during corrections amid the rise, the funding rate dropped to 0.01%, signaling that the futures market was entering a balance between Shorts and Longs, indicating a good condition for the price to continue rising.
This happens because when there is a much greater predominance of long positions during a market rally, the result ends up being unfavorable for the continuation of the rally. The market becomes “heavy” with Longs, favoring large liquidations from these traders with strong and sudden drops.
Funding Rate Pattern in Bear Markets
During Bear Markets, the negative Funding Rate is already something common to happen, and it does not represent buying opportunities as in the Bull Run, but the trend is for the price to continue falling until the Bottom.
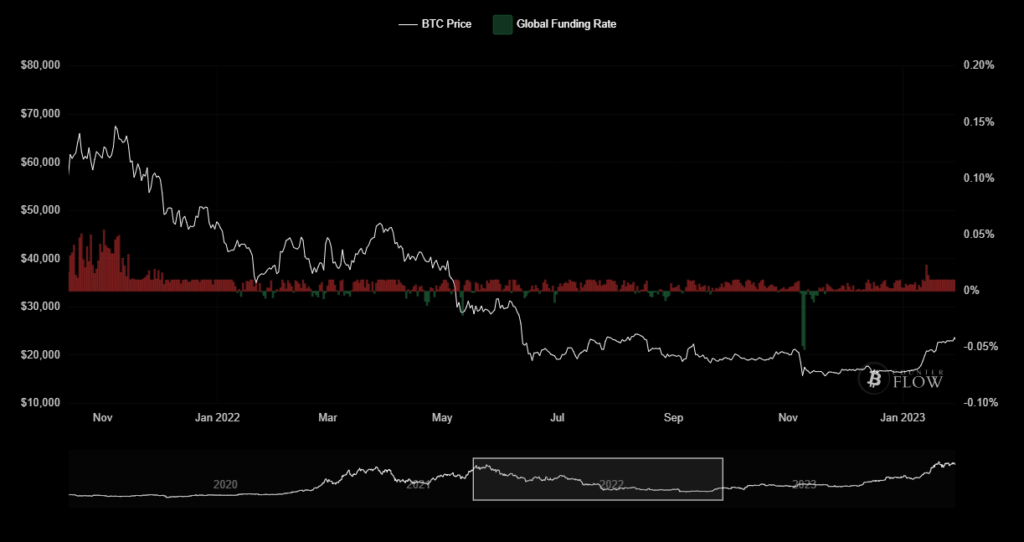
The price bottom will be marked with an extremely negative FR, evidencing the exhaustion of the downtrend where several traders bet on the fall just at the most critical moment for such a decision.
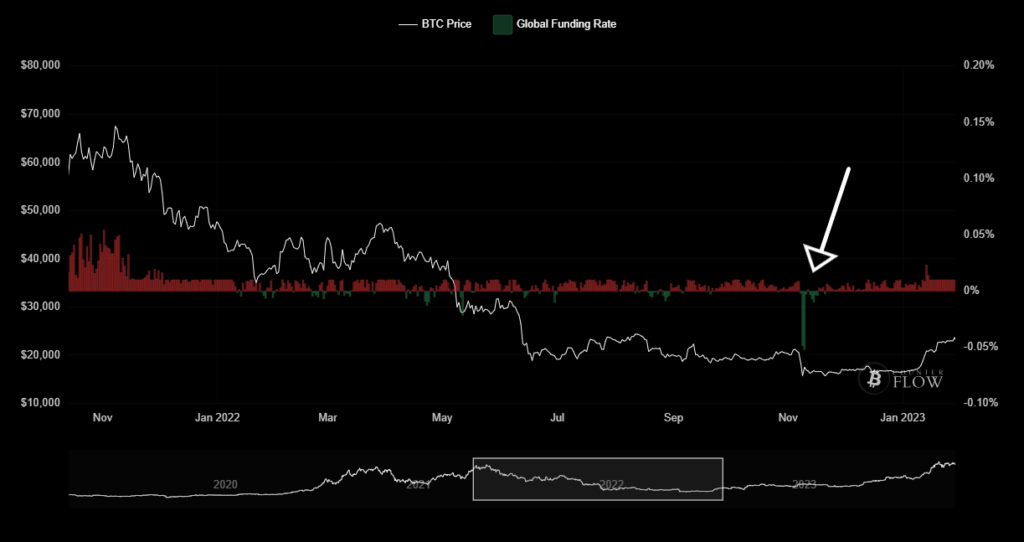
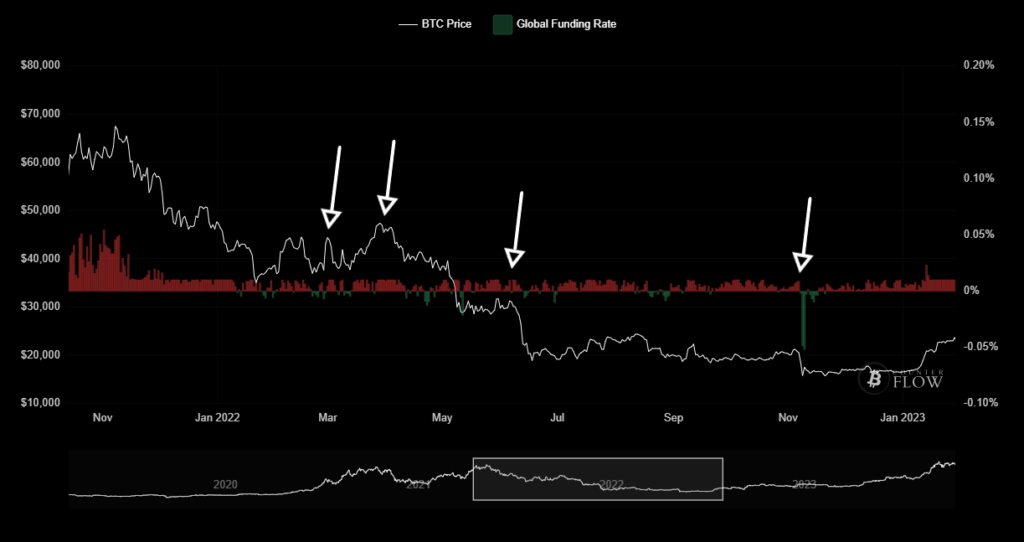
Usually, at the price bottom, pessimism is at its maximum. Another pattern observed in Bear Markets is that attempts to recover the price are marked with the FR equal to 0.01%, which shows that most traders are making the wrong decision to bet on the rise at the worst moment.
Final Tip
To improve Funding Rate analyzes, it is advantageous to use other indicators and charts, one of them being the Liquidation Pools, which shows the areas where over-leveraged traders are liquidated.
