
What are Liquidation Heatmap?
Liquidation Pools, or Liquidation Heatmap, are colored areas represented on trading charts. These areas indicate price zones with high liquidity concentration in the market. Using a mathematical algorithm, these zones identify where over-leveraged traders are likely to be liquidated. In other words, they are points where the Bitcoin price tends to move due to the pressure of liquidating excessively risky positions.
Trading Strategy with Liquidation Heatmap
To profit cautiously using the Liquidation Pools indicator, follow these steps:
1. Liquidation Heatmap Analysis
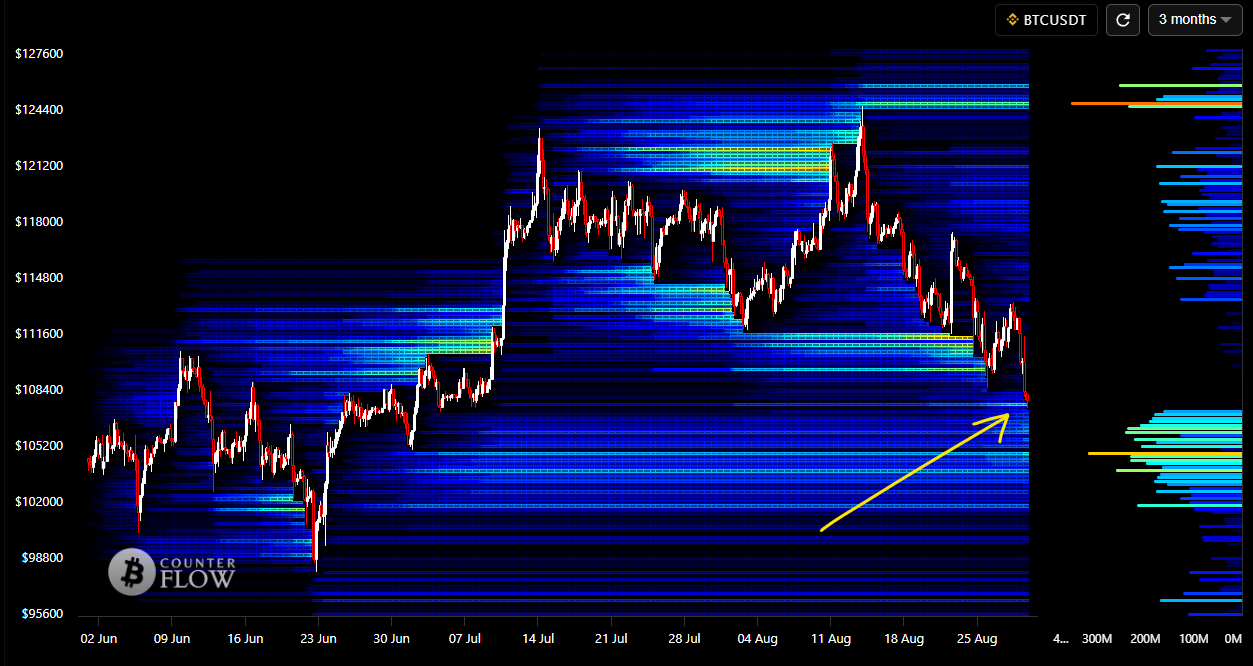
Identifying Critical Zones: Pay attention to the colored areas on the chart. The more intense the color, the higher the liquidity concentration, acting as true “magnets” for price.
Understanding Market Dynamics: Price tends to move toward these high-liquidity zones, as the forced liquidation of overleveraged positions can trigger significant price movements.
2. Planning Entries and Exits
Strategic Buys: Consider buying Bitcoin within high-liquidity zones, anticipating that price may be drawn toward nearby liquidity clusters.
Cautious Sells: Plan to sell near high-liquidity areas, where reversals are likely due to liquidations.
3. Risk Management
Setting Stop-Losses: Place stop-losses at strategic points to minimize losses if the market moves against your position.
Moderating Leverage: Avoid excessive leverage. Leveraged traders are the most exposed to liquidations, which is exactly what these zones highlight.
4. Continuous Monitoring
Real-Time Adjustments: Continuously track the Liquidation Pools chart. Liquidity zones may shift as trading volume and market dynamics evolve.
Quick Reaction: Be ready to adjust your positions promptly in response to unexpected price moves.
Benefits and Precautions
Using the Liquidation Heatmap indicator offers an advantage by anticipating price movements based on forced liquidations, allowing you to make informed decisions and increase your profit potential. However, it is crucial to remember that, like any analytical tool, it does not offer guarantees. Therefore, combining this indicator with other technical and fundamental analyses can provide a more comprehensive market view.
