 Bitcoin
Loading table...
| Date |
|---|
| No data |
Loading chart...
Loading dashboard...
CounterFlow Analysis

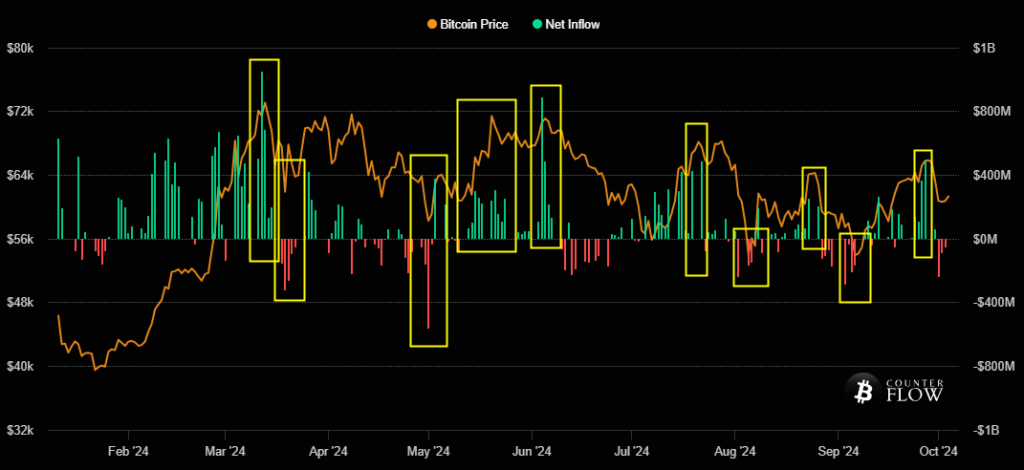
There is a noticeable correlation between Bitcoin’s price tops and bottoms and the days with the largest inflows and outflows. However, it’s important to remember that correlation does not imply causation, and these price movements are not directly driven by ETF investors alone.
We interpret this correlation as a reflection of broader market behavior, as it is common for the majority of investors to buy at peaks and sell at lows, often contributing to price stagnation.
Our strategy is to take the opposite approach of these investors, who are more influenced by the emotional highs of price surges and the fear of price declines. We prioritize buying during moments of fear and selling during moments of euphoria.
You also may like: CounterFlow ETF Strategy
