 Bitcoin
M2 Global Supply Growth YoY and YoY Growth Rate
Data from the top 21 Central Banks

Chart Explained
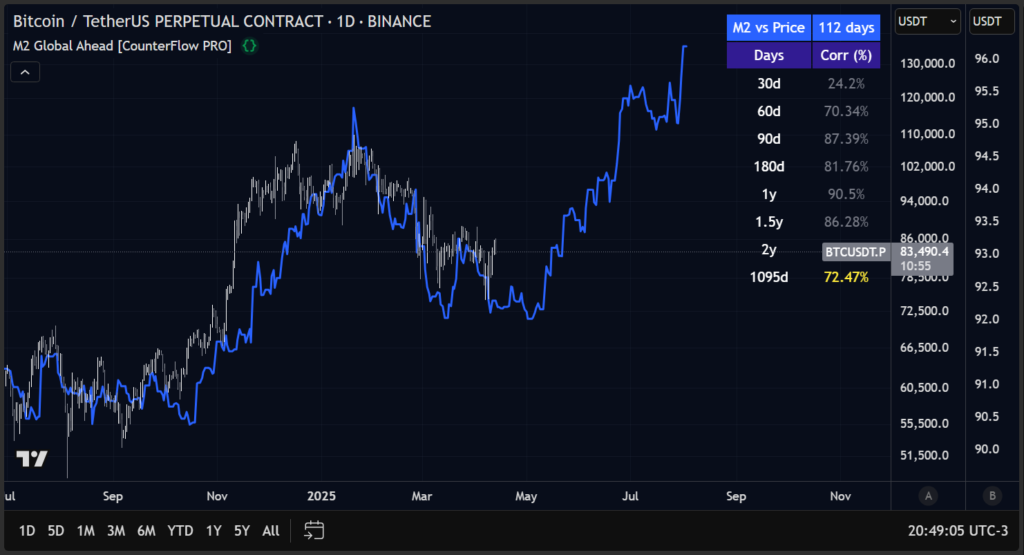
This chart illustrates the year-over-year growth in the global money supply (M2) from the top 21 central banks, compared to the price of Bitcoin. The M2 Global measure includes cash, checking and savings deposits, money market accounts, and smaller deposits under $100,000.
An increase in global liquidity indicates that major central banks are making more money available to their economies. They typically achieve this by lowering interest rates or purchasing government bonds and other securities to expand the money supply.
When comparing Bitcoin’s price to the M2 growth rates of central banks like the FED, ECB, PBoC, BoJ, and others, there is a clear correlation—Bitcoin tends to rise in tandem with the growth of the M2 supply. Historically, Bitcoin bull markets have aligned with periods of increased global liquidity.
Data for the global money supply has been sourced from the following 21 central banks:
- North America: USM, CAM
- Eurozone: EUM
- Non-Eurozone Europe: CHM, GBM, FIPOP, RUM
- Pacific: NZM
- Asia: CNM, TWM, HKM, INM, JPM, PHM, SGM
- Latin America: BRM, COM, MXM
- Middle East: AEM, TRM
- Africa: ZAM
This comprehensive data set offers insights into how global liquidity impacts the price of Bitcoin, reinforcing the historical connection between monetary expansion and Bitcoin’s bull markets.
You may also like:
M2 Global for TradingView
M2 Global Correlations
Suppose you’re looking for an indicator on TradingView that shows the correlation between the M2 Global and the price of any asset, with the added feature of adjusting the ‘offset’ of the M2 Global.
In that case, you can subscribe to our Nakamoto plan. This plan provides access to the M2 Global indicator as shown in the image below.
