
Bitcoin, Google Trends at Cycle Lows, and the Setup for the Final Flush
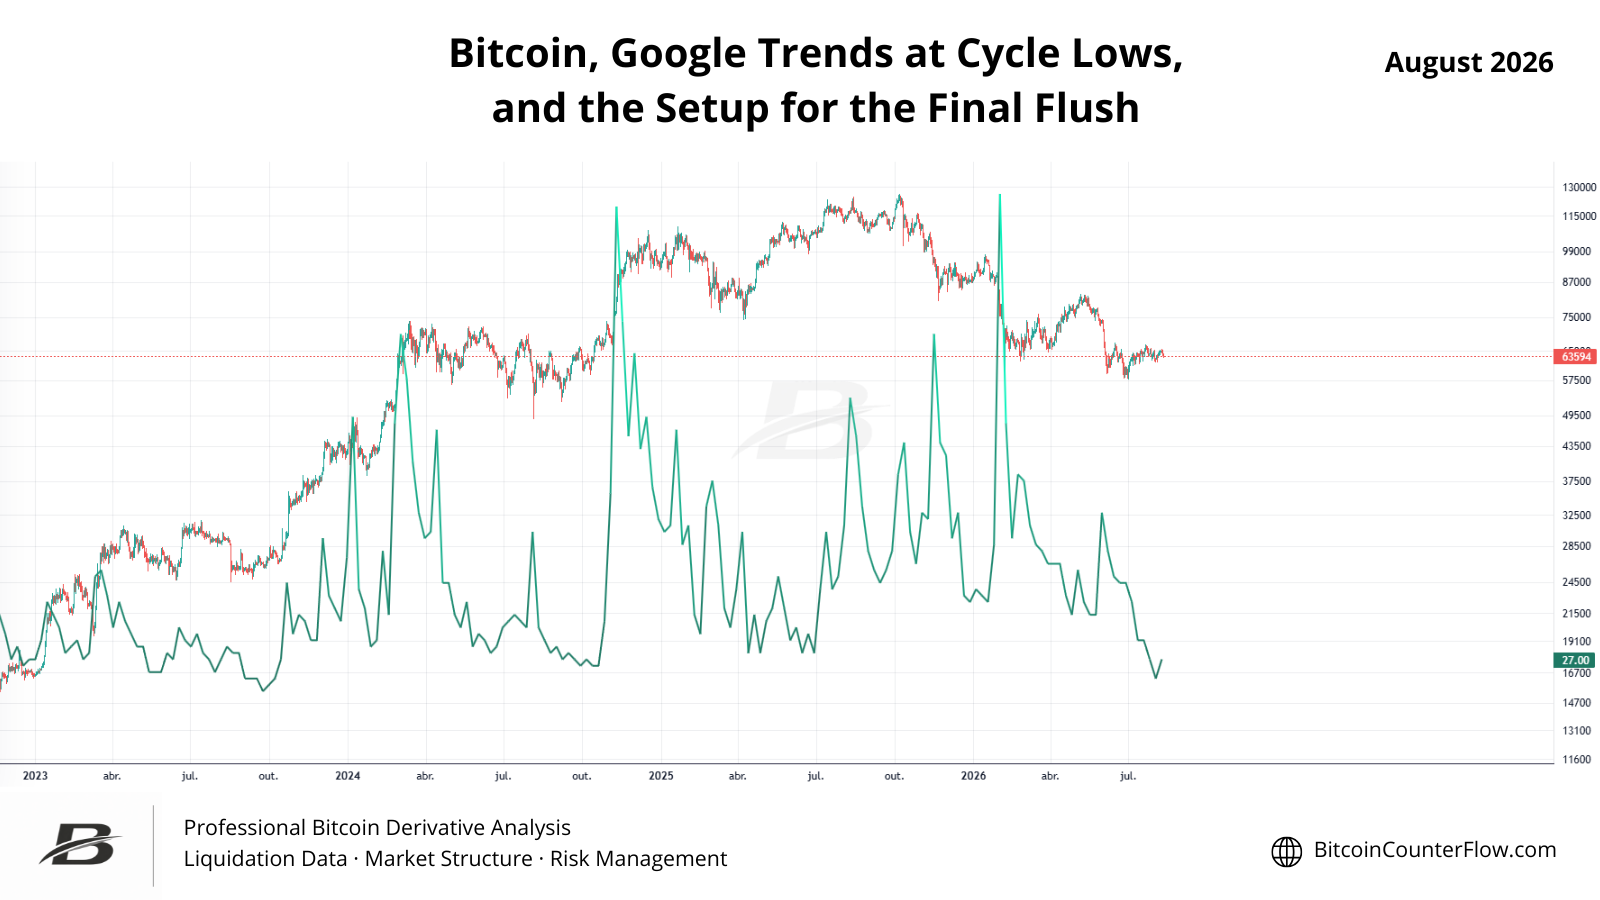
Bitcoin search interest on Google is sitting inside the lowest weeks of the entire cycle, matched only by September 2023, right before the rally that anticipated the spot ETF approval. Back then, the crowd had given up and funding was already negative. Today the crowd has also given up, but funding is still positive and open interest never really came down. That mismatch is the whole report.
A quiet market is not automatically a safe market
Bitcoin search volume on Google is nearly hitting the lowest point of this cycle. It is only beaten by September 2023, right before the rally that anticipated the approval of the spot Bitcoin ETFs in the US. Back then, price was showing very little volatility, following a drop with no clear news behind it, and market expectations were pretty pessimistic. Pessimism combined with low volatility: nobody cared about Bitcoin. Shortly after, price exploded, catching everyone by surprise.
We were bullish on that setup at the time because funding was deeply negative. The crowd had already been pushed out. This time the surface looks similar, low search interest, a bear market, a market that feels boring, but the derivative structure underneath is not the same. That difference is why we are not ready to call the bottom yet.
Bitcoin confirmed the last report
Our July report flagged that the rebound into resistance looked more like a trap-building phase than a clean trend reset, and that the better entries were likely to come after one more forced flush rather than during the relief rally itself. Since then, Bitcoin did register a leg down into the high-$50k range before stabilizing. The move confirms the broader read: this bear market has not finished cleaning out leverage, and every bounce still needs to be treated with suspicion until proven otherwise.

The lowest weeks of search interest in the cycle
The table below lists the eight lowest weeks of Google search interest for Bitcoin since our data begins in November 2022, ordered chronologically. Six of the eight sit in a single narrow window: September and October 2023. Only one other week has come close since, and it is the current one.
| Week | Trends score | BTC price then | Return to today |
|---|---|---|---|
| May 14, 2023 | 25 | $26,901.90 | +205.5% |
| May 21, 2023 | 25 | $26,732.80 | +207.5% |
| Sep 10, 2023 | 24 | $25,828.40 | +218.2% |
| Sep 17, 2023 | 24 | $26,514.20 | +210.0% |
| Sep 24, 2023 | 23 | $26,232.40 | +213.3% |
| Oct 8, 2023 | 24 | $27,901.20 | +194.6% |
| Oct 4, 2026 | 22 | $86,482.80 | -5.0% |
| Oct 11, 2026 | 19 | $83,723.00 | -1.8% |
The 2023 cluster came right before one of the strongest rallies of the cycle. That comparison is exactly why people get excited when they see this table for the first time. But the setup that made 2023 work was not the low search interest by itself. It was low search interest combined with a market that had already forced leveraged longs out. That second condition is what is currently missing.
Why the crowd is wrong: leverage never really left
This is the core of the report. We pulled funding rate, open interest, MVRV and NUPL for the same three moments: the November 2022 cycle low, the September 2023 despair window, and today.
| Metric | Nov 2022 (cycle low) | Sep 2023 (despair) | Now |
|---|---|---|---|
| BTC price | $16,272.60 | $26,514.20 | $82,191.70 |
| Funding rate (daily) | -0.17% | -0.24% | 0.58% |
| Open Interest | 119,228 BTC | 86,573 BTC | 94,395 BTC |
| MVRV | 0.80 | 1.31 | 1.55 |
| NUPL | -21.8 | 23.8 | 34.9 |
At both prior moments, funding rate was negative. That means leveraged traders were paying to stay short, a sign the crowd had already capitulated and was betting on further downside right before the market proved them wrong. Today funding is positive, and it has stayed positive on the large majority of trading days over the past two months. Open interest also never fell to the kind of washed-out levels seen at the two prior extremes. In plain terms: sentiment has gone quiet, but leverage has not been punished yet. Those two things usually need to happen together before a durable bottom forms.
What cycle history says about how much room is left
Bitcoin bear markets have historically ended with drawdowns well beyond where price sits today. The table below compares the two prior full cycles with the current one.
| Cycle | Top | Bottom | Drawdown | Duration |
|---|---|---|---|---|
| 2017-2018 |
$19,798.68
Dec 17, 2017
|
$3,156.26
Dec 9, 2018
|
-84.1% | ~12 months |
| 2021-2022 |
$69,198.70
Nov 7, 2021
|
$15,443.20
Nov 20, 2022
|
-77.7% | ~13 months |
| 2025-present |
$126,208.50
Oct 5, 2025
|
$82,191.70
Oct 16, 2026 (ongoing)
|
-34.9% | ~13 months |
This is not a guarantee that history repeats to the decimal point, and we do not treat it as one. But it is a useful reference for expectations. If the current cycle follows a similar rhythm, a drawdown in the 55k area or lower would not be unusual, and it would also be the kind of move that finally forces funding negative and flushes open interest out of the market.
The thesis: one more flush before the bear market ends
Putting the three tables together: search interest says the crowd has stopped caring, but funding and open interest say the crowd is still leveraged long. That combination, quiet sentiment plus stubborn leverage, is a leverage trap, not a bottom. We think price is still more likely to test the 55k area, or lower, before the bear market closes.
The most likely scenario is history rhyming again: the bear market wrapping up in the coming months with a higher-volume capitulation candle, alongside genuinely pessimistic sentiment coming out of that drop, not the mildly bored sentiment we see today. We would also not be surprised to see the collapse of a leveraged crypto company along the way, since periods like this tend to expose firms with poor risk management and spending discipline.
What CounterFlow watches
- Funding rate turning meaningfully negative while price is falling is historically a better bottom signal than low search interest alone.
- Open interest dropping sharply, not gradually, tends to mark the point where leverage has actually been cleared.
- Google Trends reaching new cycle lows is useful context, but it works best as confirmation, not as a standalone trigger.
- Liquidation Heatmap PRO zones below price remain the areas most likely to attract a forced flush while open interest stays elevated.
Closing thought
We keep coming back to the same idea: watch out for herd mentality, in both directions. Right now most people do not even care about Bitcoin anymore, and plenty are saying the asymmetry is gone. Underneath that boredom, the crowd is still leveraged long. We would rather wait for both conditions to align, quiet sentiment and cleared leverage, than assume a quiet chart is automatically a safe one. Until funding actually breaks negative, we are still positioned for one more leg down, calmly waiting to buy cheap.